

Why Data Display Matters More Than Reporting
Do traditional reporting methods feel like a waste of time?
Traditional reports are often cluttered with endless rows of data and complex tables, making it hard to extract meaningful insights quickly. This can lead to delayed decisions and missed opportunities in optimizing PPC campaigns.
Data display transforms raw data into clear, visual formats that are easy to understand and act upon. This approach goes beyond just presenting numbers—it tells a story that highlights trends, anomalies, and actionable insights at a glance.
Practical Tips:
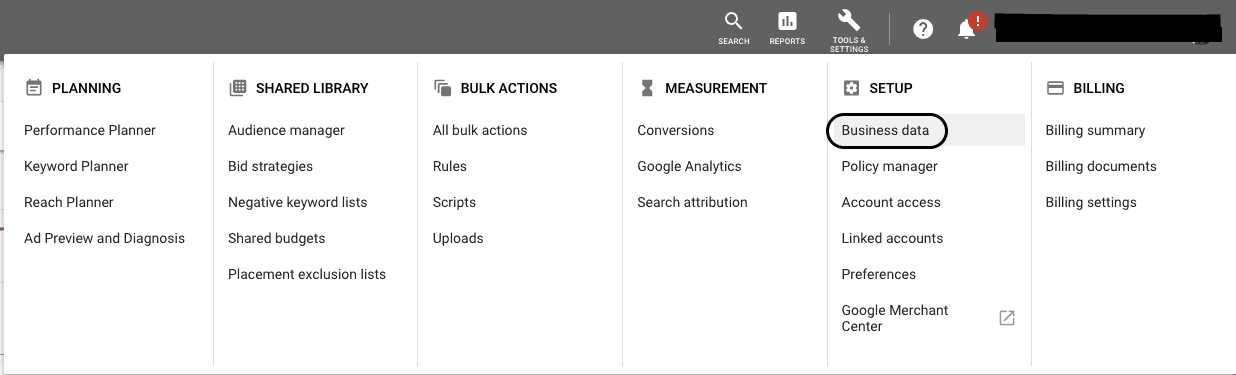
- Use tools like Google Data Studio to automate data collection and visualization. This saves time and ensures your data is always up-to-date.
- Incorporate charts, graphs, and color-coded indicators to highlight key performance metrics.
- Tailor your data displays to the needs of different stakeholders. Business owners might need high-level overviews, while PPC managers need detailed, granular data.
- Implement conditional formatting and alerts for key metrics like CTR, CPC, and ROAS. This helps in quickly identifying and addressing any issues.
- Interactive dashboards allow users to drill down into the data for more detailed analysis, providing both a macro and micro view of performance.
- Design your data displays to answer specific questions and guide the next steps in your PPC strategy.
Switch to data display for a smarter, more effective way to manage your PPC campaigns.
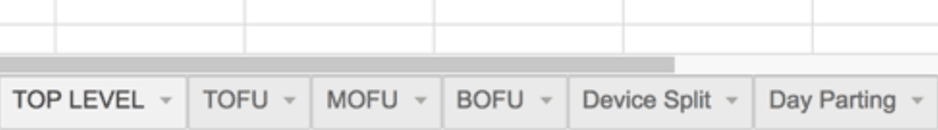
Our “Dig Deeper” Report Rhythm
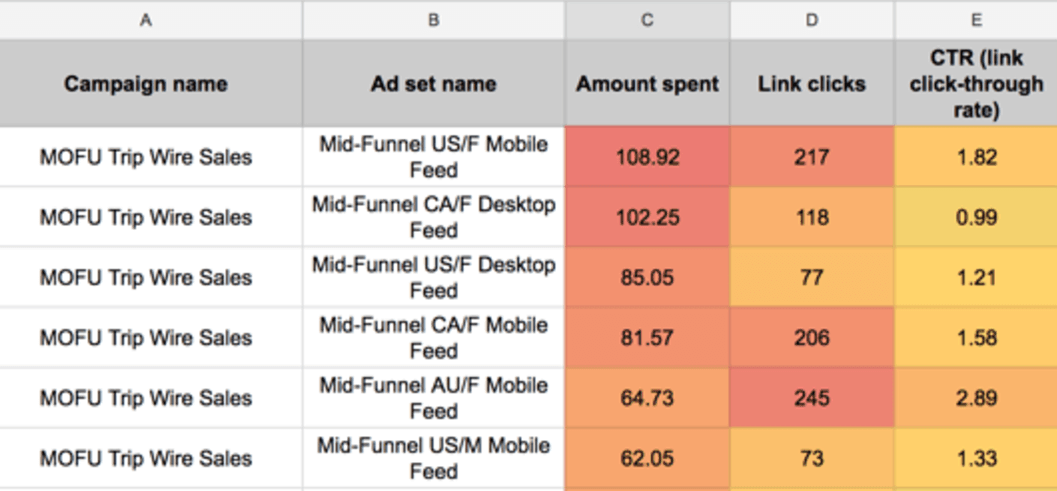
Color coding for faster decisions in optimization
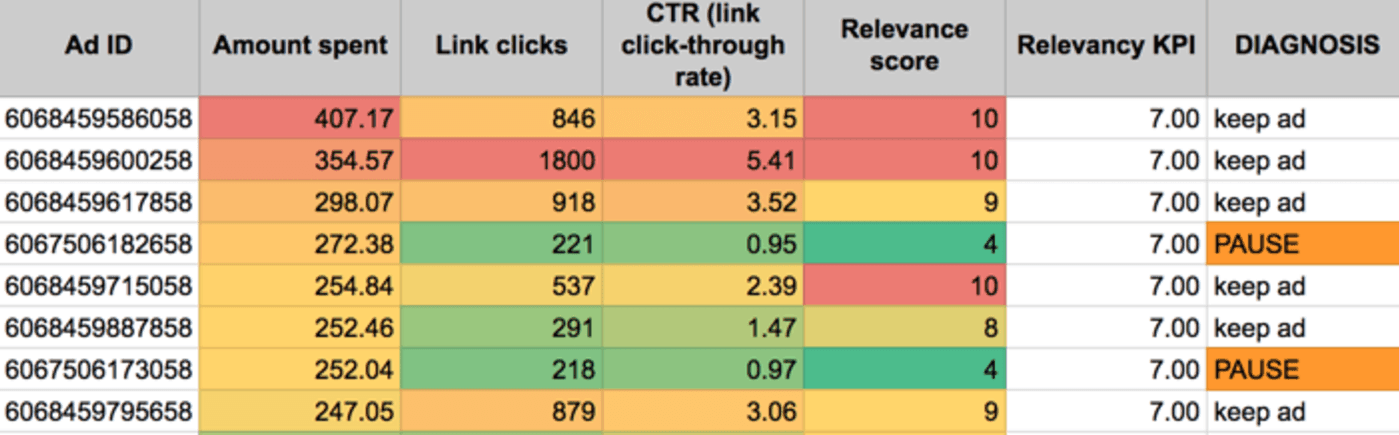
Ad diagnosis - to pause or not to pause


3 thoughts on “Report Theory: Transforming PPC with Smart Data Display”
Challenges that stuff up your ability to achieve 100% automation: Custom built CRM with no capability to push data to Google Sheets via scripts/API, split-testing using 3rd party software, attribution reporting, CRO using 3rd party tools (conversion funnels, form analytics, etc), long sales cycle whereby you need to constantly recheck customer LTV as it span over 5 years, cross-category purchase (total campaign cost acquired on one product but they end up buying another product), variable revenue business with no set average conversion value (e.g. travel packages) is asking that you constantly export and calculate ROAS within the sheet, variable target ROAS since some products have much higher profit margins, moving targets due to seasonality…
Conditional formatting is definitely a lovely thing (see my daily report filled with it) 🙂 I like it bright and wonderful
https://uploads.disquscdn.com/images/5992fe3189f82e2c286f5ccba0c8b1b12f9749e7ea0e01db461aa965be04beff.png
https://uploads.disquscdn.com/images/53ba3ab51930739dd3fe453f63b4919b7c63e31ea7ccb0947796f78dcb87e4a6.png
I knew I liked you 😀
Great comment, and those are absolutely things that muddy reporting.
That said, wouldn’t you say those are separate reports for separate purposes?
i.e. if you have CRO 3rd party tools, you would simply look at CRO reporting on its own tab..
If you always take the top of the top (top ad, top landing page), you will be on the slow march to stronger metrics over time.
tldr: data is never perfect 🙁
I really really like your way of thinking in terms of keeping data within one sheet with multiple tabs. Your team members are lucky to have access to pre-recorded videos that form part of their training 🙂
Ouchie for the muddy reporting – but you are completely right with your statement.
I would definitely vote for having your CRO and other metrics sit within its own tab if possible.
“If you always take the top of the top (top ad, top landing page), you will be on the slow march to stronger metrics over time.” I like this approach. It makes me think of this article that sparked a new way in which I organise my campaigns: “Keywords. Treat them like employees. If they are not working, fire them” https://tenscores.com/blog/keywords/ —- It boils down to your argument of honing in on selecting the top of the top.
A bit off-topic, but kinda relates to your “don’t make me think” suggestion:
Don’t you reckon it’s just better to set custom rules/alerts or create custom scripts to eliminate you even having to import data to spreadsheets? I mean write a script TO NOTIFY the ads manager via email if keywords/ads/campaigns meet certain conditions. Even better – apply the changes if it meets certain criteria. I mean this will keep your reports even cleaner.
My next quest is to set up reporting dashboards to display on TVs within our office. Aforesaid coupled with spreadsheets = massive winnings! Klipfolio even allow you to set target goals. https://goo.gl/Cse4YB
Thanks once again for creating content and frameworks that challenge the standard 🙂