
Just think. There are 1,000’s of advertisers running ads right now without knowing what their ROAS or ACOS targets are.
They operate on feelings: “It FEELS like things are improving.”
They are then doomed since their optimization can’t be centered around a target. Don’t be doomed.
Knowing how to determine ACOS helps you assess whether your ads are cost-effective and if you’re getting a good return on investment.
Calculate your minimum ROAS and maximum ACOS with this video.
Table of Contents
SO WHAT ON EARTH ARE ROAS AND ACOS?

Here we go. ROAS stands for Return on Ad Spend, also known as Revenue Over Ad Spend.
P.S. We wrote an in-depth article about ROAS here.
So for example, if you generate a $100 in sales from $20 of ad spend, that would be a return on ad spend of 5X, sometimes referred to as 500% (multiply it by 100 at the end there).
So it’s very simple, 100 over 20 equals five, simple as that.
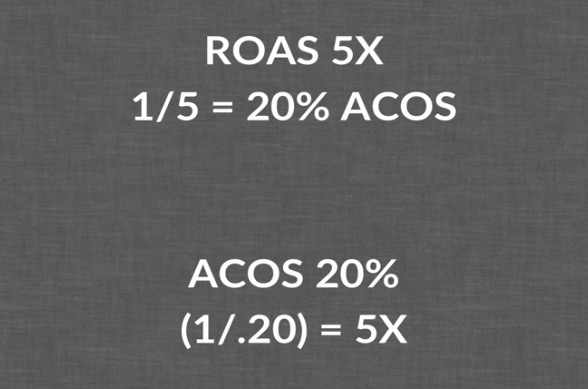
On the other end of the spectrum, we have ACOS, which stands for ad cost of sales, also know as Ad Cost Over Sales. Very simple, if you have $20 ad cost and revenue of 100 bucks, then your ACOS would be 20%. And if you were paying attention, you know it’s representing the exact same thing. A ROAS of 5X is an ACOS of 20%, because 1 over 5 = 20%.
An ACOS of 20% is 1 over .2 = 5. So these are actually the same numbers and they’re used to represent the amount of revenue you have generated and the amount of ad spend you have spent
HOW TO CALCULATE YOUR BREAK-EVEN ROAS OR ACOS
Now there’s the concept of minimum Return on Ad Spend, or maximum ACOS and it is extremely important.
This is the break-even point. This is the point at where you will start losing or making money.
To calculate ACOS, simply divide your total ad spend by the total revenue generated from ads. For example, if you spent $100 and made $500 in sales, your ACOS would be 20% (100 ÷ 500 × 100).
Establishing your desired ACOS is key to guiding your marketing strategy and ensuring you’re staying within your budget while achieving sales goals.
How do we actually calculate what our minimum or maximum ACOS should be?
Figuring out how to compute ACOS can give you a better understanding of how much you’re actually spending to make a sale.
To calculate this break-even point, we just need a few things. We need revenue, cost of goods sold, and any other fees (like your Amazon fees, or merchant fees), profit per sale, and then we’re going to calculate our max ACOS and our minimum ROAS.
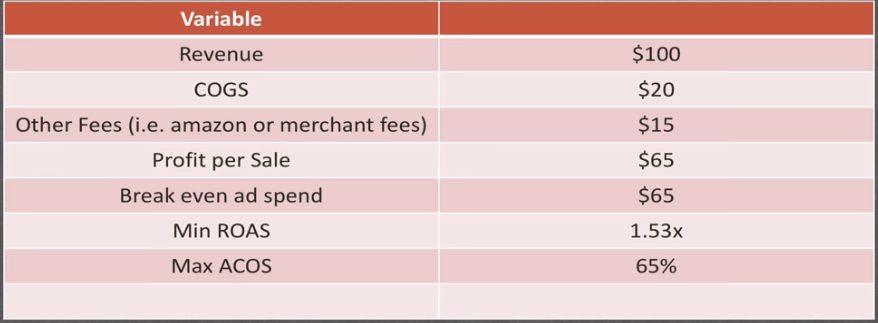
Let’s say you sell something and you generate $100 of revenue. It has cost of goods sold of 20 bucks, you have other fees accounting for $15, which gives you a profit for sale of $65, meaning every time you sell this $100 product, you make $65.
Now you’ll break even ad spend is $65. Meaning if you spend $64, you’re going to make $1 and if you spend $66, you’re going to lose a dollar. 65 is your break-even.
And when you translate spending $65 to make $100, that turns into a minimum ROAS of 1.53 and a maximum ACOS of 65%.
- Anything higher than this maximum ACOS, you’re losing money. Anything lower, you’re making money.
- Anything lower than this minimum ROAS, you’re losing money. Anything higher, you’re making money.
WHAT SHOULD MY TARGET Roas OR my target ACOS BE?
So all business have some rationale for how much they actually want to spend of their profit per sale on ads. You need to make this decision for your own business. I’ve seen people want to get very aggressive. Maybe in a situation like this, if 1.5 is the minimum return on ad spend, they only want to hit 1.7, or even 2X, and that’s it.
Your target ACOS should align with your profit margins. If your product has a 30% profit margin, your target ACOS should ideally be below 30% to remain profitable after ad costs.
I’ve seen other people that say, “Hey, I need to be really profitable with my ad spend, so I need a minimum return on ad spend, even though it’s 1.5, I want to set a target for 3X or for 4X or so.”
Your goal ACOS should align with your overall marketing objectives, helping you strike the right balance between ad spend and sales.
So it’s really up to you for deciding how much you will actually want to spend of your profit on paid ads.
Calculating ACOS accurately allows you to optimize campaigns in real time. For instance, if Campaign A has an ACOS of 12% and Campaign B is at 48%, you may want to reallocate budget toward A or investigate what’s inflating B’s spend.
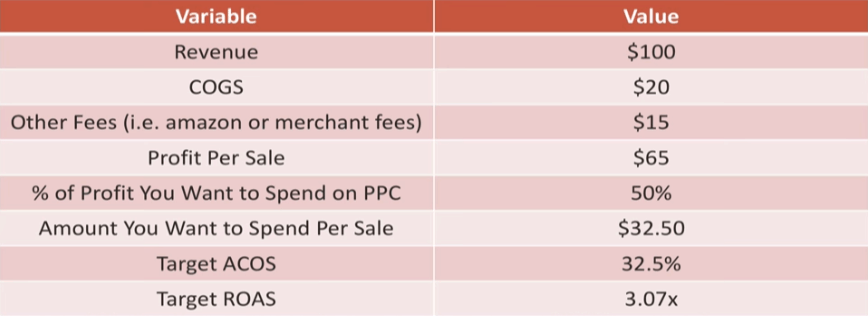
This might be a pretty simple example. So this is the exact same situation, except let’s break this down: revenue – $100, cost of goods sold – $20, other fees – $15, profit per sale – $65. So it’s the exact same product, exact same profit margin, except this time we’ve added the percent of profit you actually want to spend on paid ads, which in this case is 50%.
Which means: 50% of $65 is $32.50. Meaning, that’s their target of how much they want to spend to get a sale, which gives us a target ACOS of 32.5% or a target return ad spend of 3.0. (if you want more content on ACOS, here’s a great post on it by Ad Badger.)
HOW TO MANAGE THE ROAS OR ACOS OF MULTIPLE PRODUCTS
Learning how to figure out ACOS is a simple yet essential step to understanding the performance of your paid campaigns.
You’re right, this is really simple in theory to just go through this exercise for one product, but as soon as you start having dozens and dozens of products, this becomes a lot more challenging. So what do you actually do?
ACOS calculation becomes critical when managing multiple SKUs. A product with a $10 profit and $3 ad spend per sale yields a 30% ACOS, which may still be acceptable if you’re in a brand awareness phase.
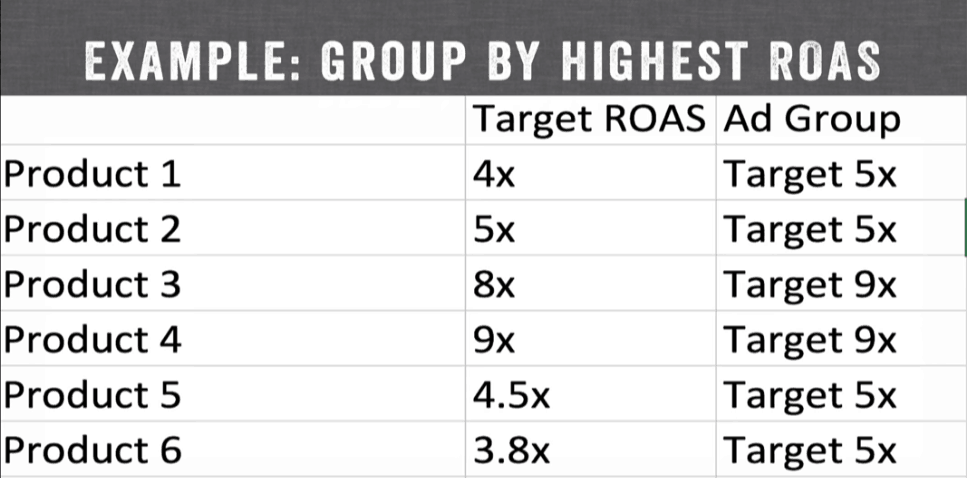
Well, you run through this exercise on all of your products, and you group them. You can group them by closely related target ROAS and then grouping them together in their ad groups.
So for example, Product 1 and 2, they both have a target return on ad spend of 4X and 5X respectively. Meaning, you just take both of these products and put them into an ad group targeting 5X. If you take a look at Product 3 and 4, you can see the same situation, their target return on ad spend is 8X and 9X. You can just take both of those and put them in the 9X target. So when you group things like this, it allows you as a starting off point to easily organize your PPC campaigns.
Defining your ideal ACOS ensures you’re not overspending on ads and are driving profitable sales efficiently.
INCLUDE YOUR TARGET ROAS or ACOS IN YOUR PPC CAMPAIGNS NAMES
As a last step, you need to be really clear with your labels so you don’t forget any of these things. Every campaign should have a KPI on it. For example: “Water Bottles + Search + Cold Traffic + ROAS 4X Target + USA”.
So I have the product that I’m selling, I’m having the network that it’s on, I’m having the audience that I’m serving it to, I’m having the return on ad spend targets and the geographic region.
Very simply, very clear, so I’ll never forget what the return on ad spend target should be when I’m optimizing that campaign.
SEGMENTING CAMPAIGNS FOR BETTER CONTROL
BENEFITS OF SEGMENTING CAMPAIGNS BY PRODUCT CATEGORIES, DEMOGRAPHICS, AND GEOGRAPHIC LOCATIONS
Segmenting your campaigns allows you to tailor your ads to specific audiences, improving relevance and performance.
By segmenting by product categories, you can create ads that highlight the unique benefits of each product.
Segmenting by demographics ensures your ads speak directly to the interests and needs of different age groups, genders, or income levels.
Geographic segmentation lets you target ads based on location, catering to local preferences and increasing your chances of conversion.
Effective segmentation leads to higher ROAS and lower ACOS.
When your ads are more relevant, they attract more clicks and conversions, making your ad spend more efficient.
Detailed Guide on Setting Up Segmented Campaigns in Google Ads
Setting up segmented campaigns can seem daunting, but breaking it down into manageable steps makes it easier.
In Google Ads, create campaigns based on demographics and geographic locations.
Utilize audience targeting to reach specific age groups, genders, and locations.
Follow these steps to set up segmented campaigns:
- Log in to your Google Ads account.
- Create a new campaign and select your campaign type (e.g., Search, Display).
- Set your campaign goals (e.g., website traffic, sales).
- Use demographic targeting to select age, gender, and household income.
- Use geographic targeting to focus on specific locations.
- Create ad groups within your campaign, each targeting a specific segment.
- Design ad creatives that resonate with each targeted segment.
Calculating minimum ROAS and Maximum ACOS - Summary of the Video notes
Here you go, the TL;DR version of the above:
- ROAS: Return on Ad Spend AKA Revenue over Ad Spend
- Spend 100, make 20 = 5x ROAS
- (Revenue / Ad Spend)
- ACOS: Ad Cost of Sales AKA Ad Cost over Sales
- (Ad Spend / Revenue)
- Spend 100, Make 20 = 20% ACOS
- These represent the same thing: the relationship between your spend and your revenue
- ROAS = 1/ACOS
- ACOS = 1/ROAS
- This is very important: the break-even point
- Minimum ROAS & Maximum ACOS
- To calculate break-even:
- Need revenue, cost of goods sold, any other fees (like Amazon Fee)
- Example: if you generate 100 dollars of revenue, with COGS of 20 dollars, and other fees of 15 per sale:
- Profit per sale: $65
- If you spend $66 on Ads, you will lose 1 dollar
- If you spend $64, you will make 1 dollar
- Your Minimum ROAS is 100/65 = 1.53
- Your Maximum ACOS is 65/100 = 65%
- You need to decide what percentage of your profit you spend per sale
- Some advertisers are very aggressive, others are much more conservative
- Example: “I want to spend 50% of my profit on ads”
- Example: I want to spend 80% of my profit on ads”
- After you establish how much you want to spend per sale, you can calculate your target ROAS and target ACOS
- This is very easy with 1 product, but it becomes a lot more challenging when you have dozens of products
- Pro tip: Group products in ROAS target-groups.
- Example:
- If you have two products with an ROAS of 4x and 5x, you can put them in the same ad group targeting 5x.
- This allows you to have a starting off-point to easily organize your campaign.
- Be sure to label or title your campaigns with the target KPI inside of it.
- Example: “Water Bottles + Target ROAS 4.5x + USA + Search + Cold Traffic”
We live, breathe & Dream Paid Traffic
OPTIMIZING CAMPAIGNS BASED ON ROAS AND ACOS
Imagine you’re playing a game of chess. Every move must be calculated to maximize your advantage and ensure victory. Optimizing your PPC bids and budgets is no different; every adjustment needs to be strategic.
The right bid can make or break your campaign. Adjusting bids without a plan can lead to wasted spend or missed opportunities.
To optimize your bids and budgets effectively, start by analyzing your ROAS and ACOS.
While ROAS (Return on Ad Spend) is revenue ÷ ad spend, ACOS is the inverse. For example, a ROAS of 4.0 (or 400%) is equal to an ACOS of 25%. Use ROAS when evaluating growth potential, and ACOS for cost-efficiency.
If your ROAS is lower than your target, it might be time to reduce your bids to improve efficiency.
Conversely, if your ROAS is high, consider increasing bids to capture more market share.
Adjusting your budget based on performance is equally important. Allocate more budget to high-performing campaigns with strong ROAS, and cut back on those with poor returns.
Regularly review your bid and budget settings. Use automation tools to adjust bids in real-time based on performance data.
TECHNIQUES FOR TESTING AND OPTIMIZING AD CREATIVES
Think of your ad creatives as the face of your campaign.
Not all ad creatives are created equal. Some will resonate with your audience better than others.
To optimize your ad creatives, start by testing different elements such as headlines, images, and call-to-actions. Track which variations perform best in terms of CTR, conversion rate, and ultimately ROAS.
High-performing creatives not only attract more clicks but also drive better conversion rates, improving your overall campaign efficiency.
Implement a structured testing process for your ad creatives. Use A/B testing to compare different versions and identify the top performers. Rotate your creatives regularly to avoid ad fatigue and keep your audience engaged.
HOW TO USE A/B TESTING TO FIND THE BEST PERFORMING ADS
A/B testing is a powerful tool for optimizing your PPC campaigns.
Start by identifying the variables you want to test—this could be ad copy, images, or targeting options. Create two versions (A and B) and run them simultaneously to see which one performs better.
The insights gained from A/B testing can significantly boost your campaign performance. By identifying what resonates most with your audience, you can refine your ads to drive higher engagement, better ROAS, and lower ACOS.

COMMON MISTAKES TO AVOID IN ROAS AND ACOS CALCULATIONS
MISINTERPRETING ROAS AND ACOS DATA
Imagine driving a car with your eyes closed, relying only on the sound of the engine to guide you. Sounds like a disaster waiting to happen, right? That’s what misinterpreting ROAS (Return on Ad Spend) and ACOS (Advertising Cost of Sales) data feels like in the world of PPC.
ROAS is the ratio of revenue generated for every dollar spent on advertising. A high ROAS might look great on paper, but what if the sales you’re generating aren’t profitable? For example, a product with high returns but thin profit margins might inflate your ROAS, misleading you into thinking your campaign is more successful than it actually is.
Instead of chasing high ROAS blindly, dig deeper. Analyze the profit margins of your products. A $100 sale with a $95 cost of goods sold isn’t as impressive as it seems.
Regularly review your ROAS and ACOS in conjunction with your profit margins. Use tools and reports that provide a holistic view of your campaign performance.
OVER-RELYING ON SHORT-TERM DATA WITHOUT CONSIDERING LONG-TERM TRENDS
Let’s talk about quick wins. Everyone loves them. But focusing only on short-term data is like planting seeds and expecting a full-grown tree the next day.
Short-term data can be very seductive. Seeing immediate spikes in sales can feel rewarding, but it’s not the whole story.
Seasonality, buying cycles, and market trends all play a crucial role in the long-term success of your campaigns.
Imagine you’re running a holiday sale. Your ACOS might spike as you ramp up spending to capture more sales. In the short term, this looks like a dip in efficiency. But over the entire season, your increased ad spend might result in significantly higher revenue and brand awareness.
Balance your analysis. Incorporate long-term data and trends into your decision-making process. Use historical data to predict future performance and adjust your strategies accordingly.
IGNORING THE IMPACT OF EXTERNAL FACTORS LIKE MARKET CHANGES AND COMPETITION
Market trends, competitor actions, and economic shifts can significantly impact your ROAS and ACOS.
For instance, a new competitor entering the market might increase your ad costs, or changes in consumer behavior could affect conversion rates.
Stay ahead of the curve by keeping a close eye on industry trends and your competitors. Regularly conduct market research to understand the broader landscape and anticipate changes that could affect your campaigns.
Adapt your strategies in response to external factors. If a new competitor is driving up costs, refine your targeting or explore new keywords. If market trends indicate a shift in consumer behavior, adjust your ad creatives and messaging accordingly.
Check out more blog posts:

Crafting Effective Demand Gen Campaigns: Best Practices for 2025


1 thought on “How to Calculate Your Target ROAS and ACOS for PPC”
Hi Michael,
Nice article – one quick question: I’m trying to analyze a large report which looks at the performance of an account over the space of 2 months. In this report I can see the KW performance for a certain day – The cost, the revenue, the ROAS etc.
I’m trying to summarize this data and show the client which ad groups and campaigns are performing well ROAS wise however since ROAS is a ratio I’m not sure how to do this. Is there another formula or method whereby ROAS can be represented as a whole number of $ amount so that it can be summarized at a campaign or ad group level?
Kind regards,
David