


Do you have an accurate view of your PPC campaigns performance?
At Search Scientists, we’re doing around 150 Google Ads audits every year. That’s about three different accounts a week.
Today, Mike discusses 12 of the most important points to check in a Google Ads audit. Fixing these will mean a massive improvement in your cost per conversion.
Make sure to subscribe to the Search Scientists YouTube channel, so you don’t miss out on weekly goodness on all things Paid Traffic.

Video Transcript
Hey, I thought that this would be a really interesting video to create. I just got done auditing a campaign on Google Ads, and I really just wanted to share what I found. So, I have some screenshots here, and I thought it would be really interesting to explain it.
| # | Audit Area | What to Check | Priority |
|---|---|---|---|
| 1 | Conversion Tracking | Duplicate tags, 1-click = multiple conversions, unverified goals | 🔴 Critical |
| 2 | Country Segmentation | CPA by country, campaigns mixed across markets | 🔴 Critical |
| 3 | Negative Keywords | Search term report — irrelevant queries eating budget | 🔴 Critical |
| 4 | Bid Strategy | Manual vs. Smart bidding fit, target CPA/ROAS set correctly | 🟠 High |
| 5 | Quality Score | Keywords with QS ≤4, ad relevance and landing page scores | 🟠 High |
| 6 | Demographic Bidding | Age, gender, income brackets — bid adjustments applied? | 🟠 High |
| 7 | Exact Match Impression Share | Lost IS (budget) vs. lost IS (rank) — root cause matters | 🟠 High |
| 8 | RLSA / Audience Layers | Remarketing lists applied to Search, bid modifiers set | 🟠 High |
| 9 | Ad Extensions | Sitelinks, callouts, structured snippets — all active? | 🟡 Medium |
| 10 | Device Performance | Mobile vs. desktop CPA, bid adjustments by device | 🟡 Medium |
| 11 | Budget Allocation | High-ROAS campaigns budget-capped, low performers overfunded | 🟡 Medium |
| 12 | YouTube Attribution | View-through conversions counted correctly, not inflating ROAS | 🟡 Medium |
Conversion Tracking
No other audit finding matters if your conversion tracking is broken. Every optimization decision — bid adjustments, budget allocation, keyword pruning — flows from conversion data. If that data is wrong, every decision downstream is wrong too, and you won’t know it until you’ve spent months optimizing toward a phantom signal.
The most common conversion tracking problem we see across hundreds of audits is tag duplication: the same conversion action fires twice because the tag is installed both via Google Tag Manager and hardcoded directly in the page source. The result is one actual purchase recorded as two conversions. Your CPA looks half as good as it actually is, Smart Bidding is trained on false data, and every report you share with a client or stakeholder is factually incorrect.
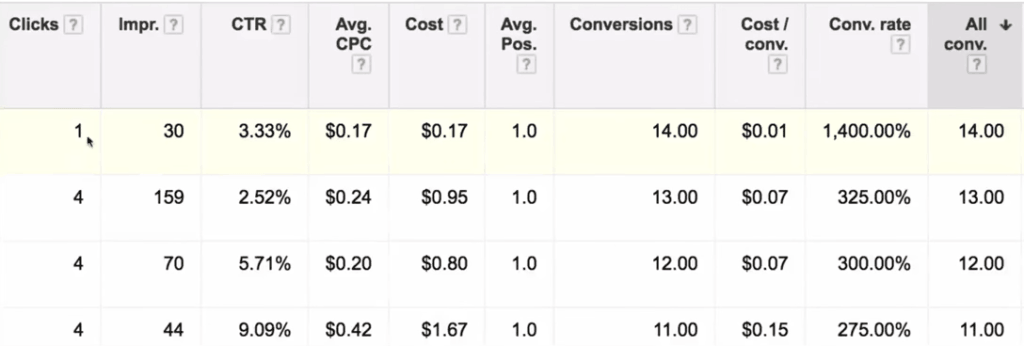
The second most common issue is micro-conversion inflation. An account that shows 14 conversions from a single click — as we found in one audit — isn’t performing at a 1400% conversion rate. It has a thank-you page that reloads on refresh, a checkout step tagged as a conversion, and a final purchase confirmation also tagged. Three events fire per transaction instead of one.
Before you touch a single bid or restructure a single ad group, pull the Search Terms report and cross-reference it against your Conversions column. Look for any click with more than one conversion. Look for conversion counts that don’t align with your actual order volume in your CRM or backend. If the numbers don’t match within 5%, stop and fix the tracking first.
| Tracking Issue | How to Identify | How to Fix |
|---|---|---|
| Duplicate conversion tags | Conversions > actual orders in CRM | Remove hardcoded tag, keep only GTM version |
| Multiple conversions per click | Filter clicks with conv. > 1 in reports | Set conversion counting to "One per click" |
| Thank-you page refire on refresh | Manually refresh confirmation page, check tag fires | Add order ID deduplication to tag trigger |
| Micro-conversions counted as primary | Conversion volume far exceeds purchase volume | Set form fills / scroll events as Secondary conversions |
| Cross-device conversions missing | Mobile click share >> mobile conversion share | Enable Enhanced Conversions in Google Ads settings |
COUNTRY SEGMENTATION
So, basically, one of the first things that I checked out in this account, which is really unique – there’s a lot of international opportunity for this particular client. And what you see here is they had 2.6 million impressions in the US, 1.5 in Brazil, 1.5 million in Serbia, so on and so forth.
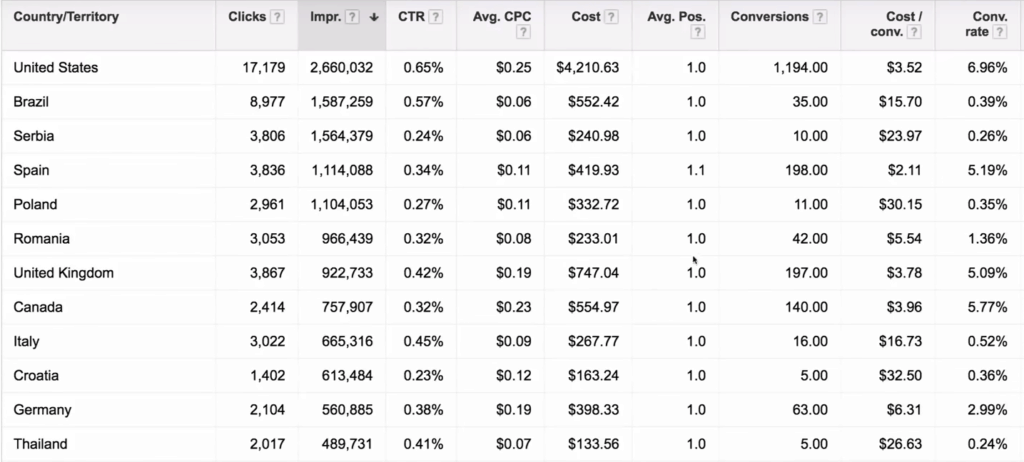
Then, when you actually take a look at the cost per conversion – it’s wildly different depending on what country that you’re in. In the US, it was $3.50 per conversion. In Brazil, it was $15.70, so the differences in conversion rates here is massive. And this particular client had no segmentation. They weren’t segmenting a US versus Brazil versus Serbia versus Spain, and all of these got a significant amount of impressions.
So, the opportunity is very apparent to fix this up. Even though we’re paying just six cents average cost per click in Brazil, we can probably reduce that even further to try to improve what’s going on here with the cost per conversion of $15 or $23 in Serbia. Then, you look at a place like Spain, which is doing even better than the US, the cost per conversion was $2.11!
So, there’s so much opportunity here to segment these campaigns throughout country, and optimize each one in a new dimension. Because currently everything is lumped together, and I wouldn’t recommend optimizing a bid at such a global level. And this was just one screenshot out of a list of dozens, and dozens of countries. So, this is definitely an area of opportunity and what I would expect to happen is once we start breaking these things out, and optimizing them independently of one another, every single country should improve.
Then, when you look at the amount of spend that they were spending, this is over the course of about a month. When you look at how much they were spending, if you can improve every single individual country 10%, 20% you can imagine what kind of grand impact that would have.
BID OPTIMIZATION
The second thing was bid optimization. This was pretty interesting. In this screenshot, basically, over the course of a particular month, $12,000 in ad spend and only about 2,000 bid changes and particularly some of these had very few bid changes.
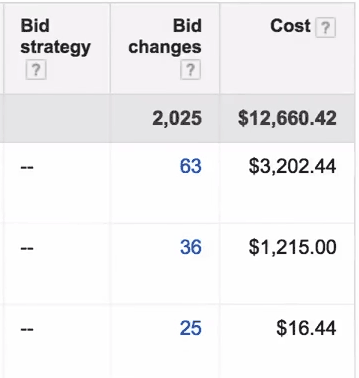
So, when you think about this, where there’s so much opportunity for optimizing bids in each individual country, they had everything lumped into one. So, they were appearing from more than 36 countries, yet they only have 36 bid changes, which is an average of less than one bid change per country. So, there’s so much opportunity there.
Negative Keywords
If conversion tracking is the most critical audit item to fix, negative keywords are the fastest way to recover wasted spend. In the typical account we audit, between 15% and 30% of total budget is consumed by search queries that have zero chance of converting — competitor brand names, informational queries, job seekers, student research, and geographic modifiers that were never intentional targets.
The search term report is the most underused tool in Google Ads. Most self-managed accounts check it occasionally but don’t build a systematic process around it. A proper audit means pulling every search term that triggered an ad in the last 90 days, filtering for queries with spend and zero conversions, and grouping them by theme. You’ll typically find 5–8 recurring irrelevant themes that account for the majority of the wasted spend.
What you add as negatives matters as much as what you exclude. Broad negatives applied at the account level can accidentally block legitimate traffic if you’re not careful. The table below shows how to categorize and correctly apply negative keywords across the three levels.
| Negative Keyword Category | Examples | Apply At | Match Type |
|---|---|---|---|
| Competitor brand names | "[competitor] reviews", "[competitor] pricing" | Campaign | Phrase |
| Informational / research queries | "how does", "what is", "definition of" | Account | Broad |
| Job seeker intent | "jobs", "salary", "career", "internship" | Account | Broad |
| Free / DIY intent | "free", "open source", "DIY", "template" | Campaign | Broad |
| Wrong geography triggers | City/country names outside target market | Campaign | Exact / Phrase |
Demographic Bidding
Google Ads gives you conversion data broken down by age bracket, gender, household income, and parental status. Most accounts either ignore this data entirely or add a token 10% bid adjustment on mobile and call it a day. That’s the equivalent of having a detailed sales report and only reading the total at the bottom.
When 67% of your conversions come from users aged 45 and up — as we found in the account discussed in this article — but that age group receives the same bids as 18–24 year olds who convert at zero percent, you are actively subsidizing your worst audience at the expense of your best one. The 18–24 segment in that account consumed 18% of clicks with no return. That isn’t a targeting problem — it’s a bidding problem. A bid adjustment of −100% on 18–24 effectively excludes them and reallocates that budget to the 45+ group that’s already proven it buys.
Pull your demographic performance report for the last 90 days. Set your columns to show Impressions, Clicks, Conversions, Cost per Conversion, and Conversion Rate. Sort by Cost per Conversion. The segments at the bottom of that sorted list are where you start applying negative bid adjustments.
| Age Group | % of Clicks | % of Conversions | Conversion Rate | Recommended Bid Adj. |
|---|---|---|---|---|
| 18–24 | 18% | 0% | 0.0% | −100% (exclude) |
| 25–34 | 22% | 8% | 1.4% | −20% |
| 35–44 | 10% | 25% | 9.6% | +15% |
| 45+ | 50% | 67% | 5.1% | +25% |
CONVERSION TRACKING
The third thing – conversion tracking – was a bit off in a few certain areas.
So, if you actually take a look at this, there was one particular click that led to 14 conversions. It’s like a conversion rate at 1400%. So, there’s something a little bit off with their conversion tracking. It’s always good to do a conversion tracking audit. Just look at – what counts as a conversion? How are we tracking it? Is this truly accurate?
There were probably maybe 10 rows that had over two conversions in this spot, so it’s always good to sort of be aware of that.
OPTIMIZe by age
Now, this one was really interesting – conversions by age. The age breakdown of conversions and spend was very distinct.
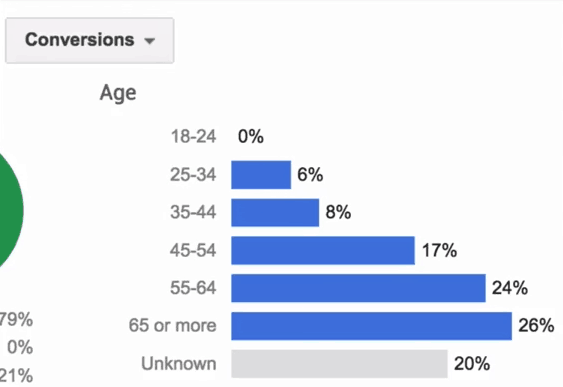
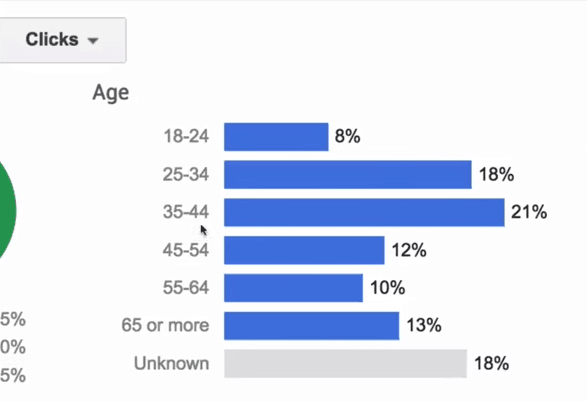
So this is from a display ad, and this display ad was doing quite well, it was generating conversions at a fairly good cost per conversion.
And if you take a look at it, where the conversions actually came from, the thing that I wrote down over here was 67% of their conversions come from people who are 45 and up. 67%, so two-thirds of their conversions: 45 and up. Then, if you look at their clicks it doesn’t match up. In fact, if you look at the click breakdown most of the clicks are not coming from 45 and up.
So, in fact, over 50% of clicks were not coming from 45 and up. So, there’s some good opportunity there to either trim the dead weight, of this age range of 18 to 24 barely converts at all. In fact, it hasn’t gotten any conversions. 25 to 34 – the conversions are pretty low, 6% of conversions. But 18% of ads have clicks.
Fixing this would be a huge cost per conversion fix.
SEARCH EXACT MATCH IMPRESSION SHARE
This particular client didn’t have search on, and they said, “Oh, you know, it wasn’t really working, so we wanted to turn it off.”
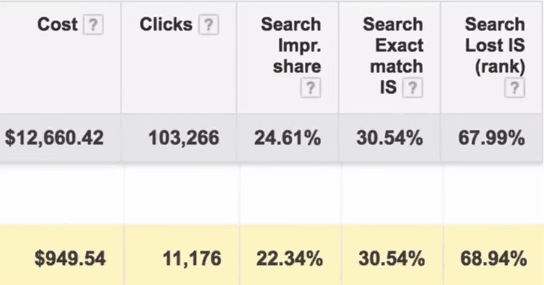
And if you take a look here the Exact Match Impression Share was only 30%, so what that means – they had a lot of terms that were broaden phrase, modified broad that they actually weren’t appearing for.
They were showing up for the variants of these terms 70% of the time. So, Search Exact Match Impression Share is something that not a lot of people understand, but basically if I’m bidding on sunglasses broad match I might show up for kids sunglasses, or sun visor. And in this case, they were showing up for words that were not sunglasses 70% of the time, so they were only appearing for sunglasses 30% of the time. So, that’s what Search Exact Match Impression Share means.
SEARCH retargeting
The other big thing, they had no retargeting on search. RLSA, they didn’t have any audience based search modifiers, where you can bid differently on genders, or ages, or audiences and things like that.
invest more in youtube
And then, on YouTube, they were getting two cent views with YouTube ads, but one of the things that was happening was they didn’t really know how to translate that back into actual tangible business results, so that was a conversation that we’re definitely going to have.
So, this was just a quick video talking about a few things that I like to look for whenever I audit an Google Ads campaign. Hope you found this useful.
Quality Score
Quality Score is the metric most advertisers monitor but fewest actually fix. It’s reported on a 1–10 scale per keyword, and the gap between a Quality Score of 4 and a Quality Score of 8 is not cosmetic — it directly determines how much you pay per click in the auction. Google charges a CPC premium for low Quality Scores and awards a discount for high ones. An account-wide Quality Score of 5 versus 8 on the same keywords can represent a 30–40% difference in cost per click — on the same budget.
Quality Score has three components: Expected CTR, Ad Relevance, and Landing Page Experience. Each is rated Below Average, Average, or Above Average. The fastest wins in an audit usually come from Ad Relevance — tight ad groups where every keyword in the group is reflected directly in the ad headline. Most self-managed accounts have ad groups with 20–50 loosely related keywords feeding into one generic ad, which scores Below Average on relevance for most of them.
Landing Page Experience is the hardest to fix and the most valuable when you do. It measures whether the page a user lands on after clicking your ad is relevant, fast, and easy to navigate on mobile. A slow landing page (over 3 seconds load time) alone can suppress your Quality Score enough to cost you significant auction position even with aggressive bids.
| Quality Score | CPC Adjustment vs. QS 6 baseline | What It Means |
|---|---|---|
| 1–3 | +400% premium | Severely misaligned ad group — pause or rebuild |
| 4–5 | +25–67% premium | Below average — tighten ad groups, improve headlines |
| 6–7 | Baseline (0%) | Average — room to improve landing page alignment |
| 8 | −25% discount | Strong — maintain and protect structure |
| 9–10 | −50% discount | Excellent — bidding at half the cost of QS 4 competitors |
Summary
A Google Ads audit is not a one-time cleanup task — it’s a diagnostic process that reveals whether the decisions being made inside your account are based on accurate data, efficient structure, and deliberate targeting. Most accounts that underperform don’t have a strategy problem. They have a tracking problem, a segmentation problem, or a bidding problem that has been compounding quietly for months while the monthly reports showed “optimizations in progress.”
The 12-point checklist in this guide is organized by impact, not alphabetical order. Conversion tracking comes first because everything else you measure depends on it being correct. Country segmentation comes second because a blended CPA across markets with a 4x performance gap isn’t a number you can optimize toward — it’s an average of two completely different businesses running in the same campaign. Negative keywords come third because wasted spend on irrelevant search terms is recoverable immediately, often within the first week of implementation.
Quality Score, demographic bidding, impression share, and RLSA are structural optimizations that compound over time. They don’t produce overnight results, but they fundamentally lower your cost per click, improve your auction position, and ensure that the budget you’re spending reaches the people most likely to convert — not the broadest possible slice of the internet.
The most important thing this audit process reveals is the gap between what you think your account is doing and what it’s actually doing. An account that reports a 4% conversion rate but has duplicate conversion tags is not a 4% conversion rate account. An account that appears to run in three countries but has no country-specific campaigns has no idea which market is profitable. An account that has never applied demographic bid adjustments is treating a 45-year-old buyer with proven purchase intent identically to an 18-year-old who has never converted.
Fix the foundation first. Then optimize. In that order, every time.